Shell Fleet Solutions
TCO & Transition Calculator
Data-driven TCO analysis and EV transition planner for commercial fleet managers
Scope
Product Strategy, UX Research, Fleet Analytics Dashboards, Interaction Design & Prototyping, Frontend Integration
My role
Lead Product Designer (Sole Designer)
Tools


Overview & Problem Space
Description
Commercial fleet operations are under immense pressure to reduce operational expenditures (OpEx) while hitting strict corporate carbon-neutrality targets. However, calculating the Total Cost of Ownership (TCO) for replacing Internal Combustion Engine (ICE) vehicles with Electric Vehicles (EVs) involves dynamic variables: fuel/electricity prices, localized EV charging infrastructure, maintenance decay curves, vehicle depreciation, and charging downtime.
The Problem
Fleet operations managers relying on traditional static spreadsheets face critical hurdles:
- Manual Data Fatigue: Processing data across fuel receipts, EV tariffs, and maintenance logs manually takes days.
- Low Stakeholder Buy-in: Financial directors distrust abstract environmental promises without clear financial breakeven trajectories (ROI, payback period in months).
- Paralysis by Analysis: Difficulty visualizing how subtle shifts in vehicle mix (e.g., 45% EV vs 100% ICE) impact cash flow over a 5-year timeline.
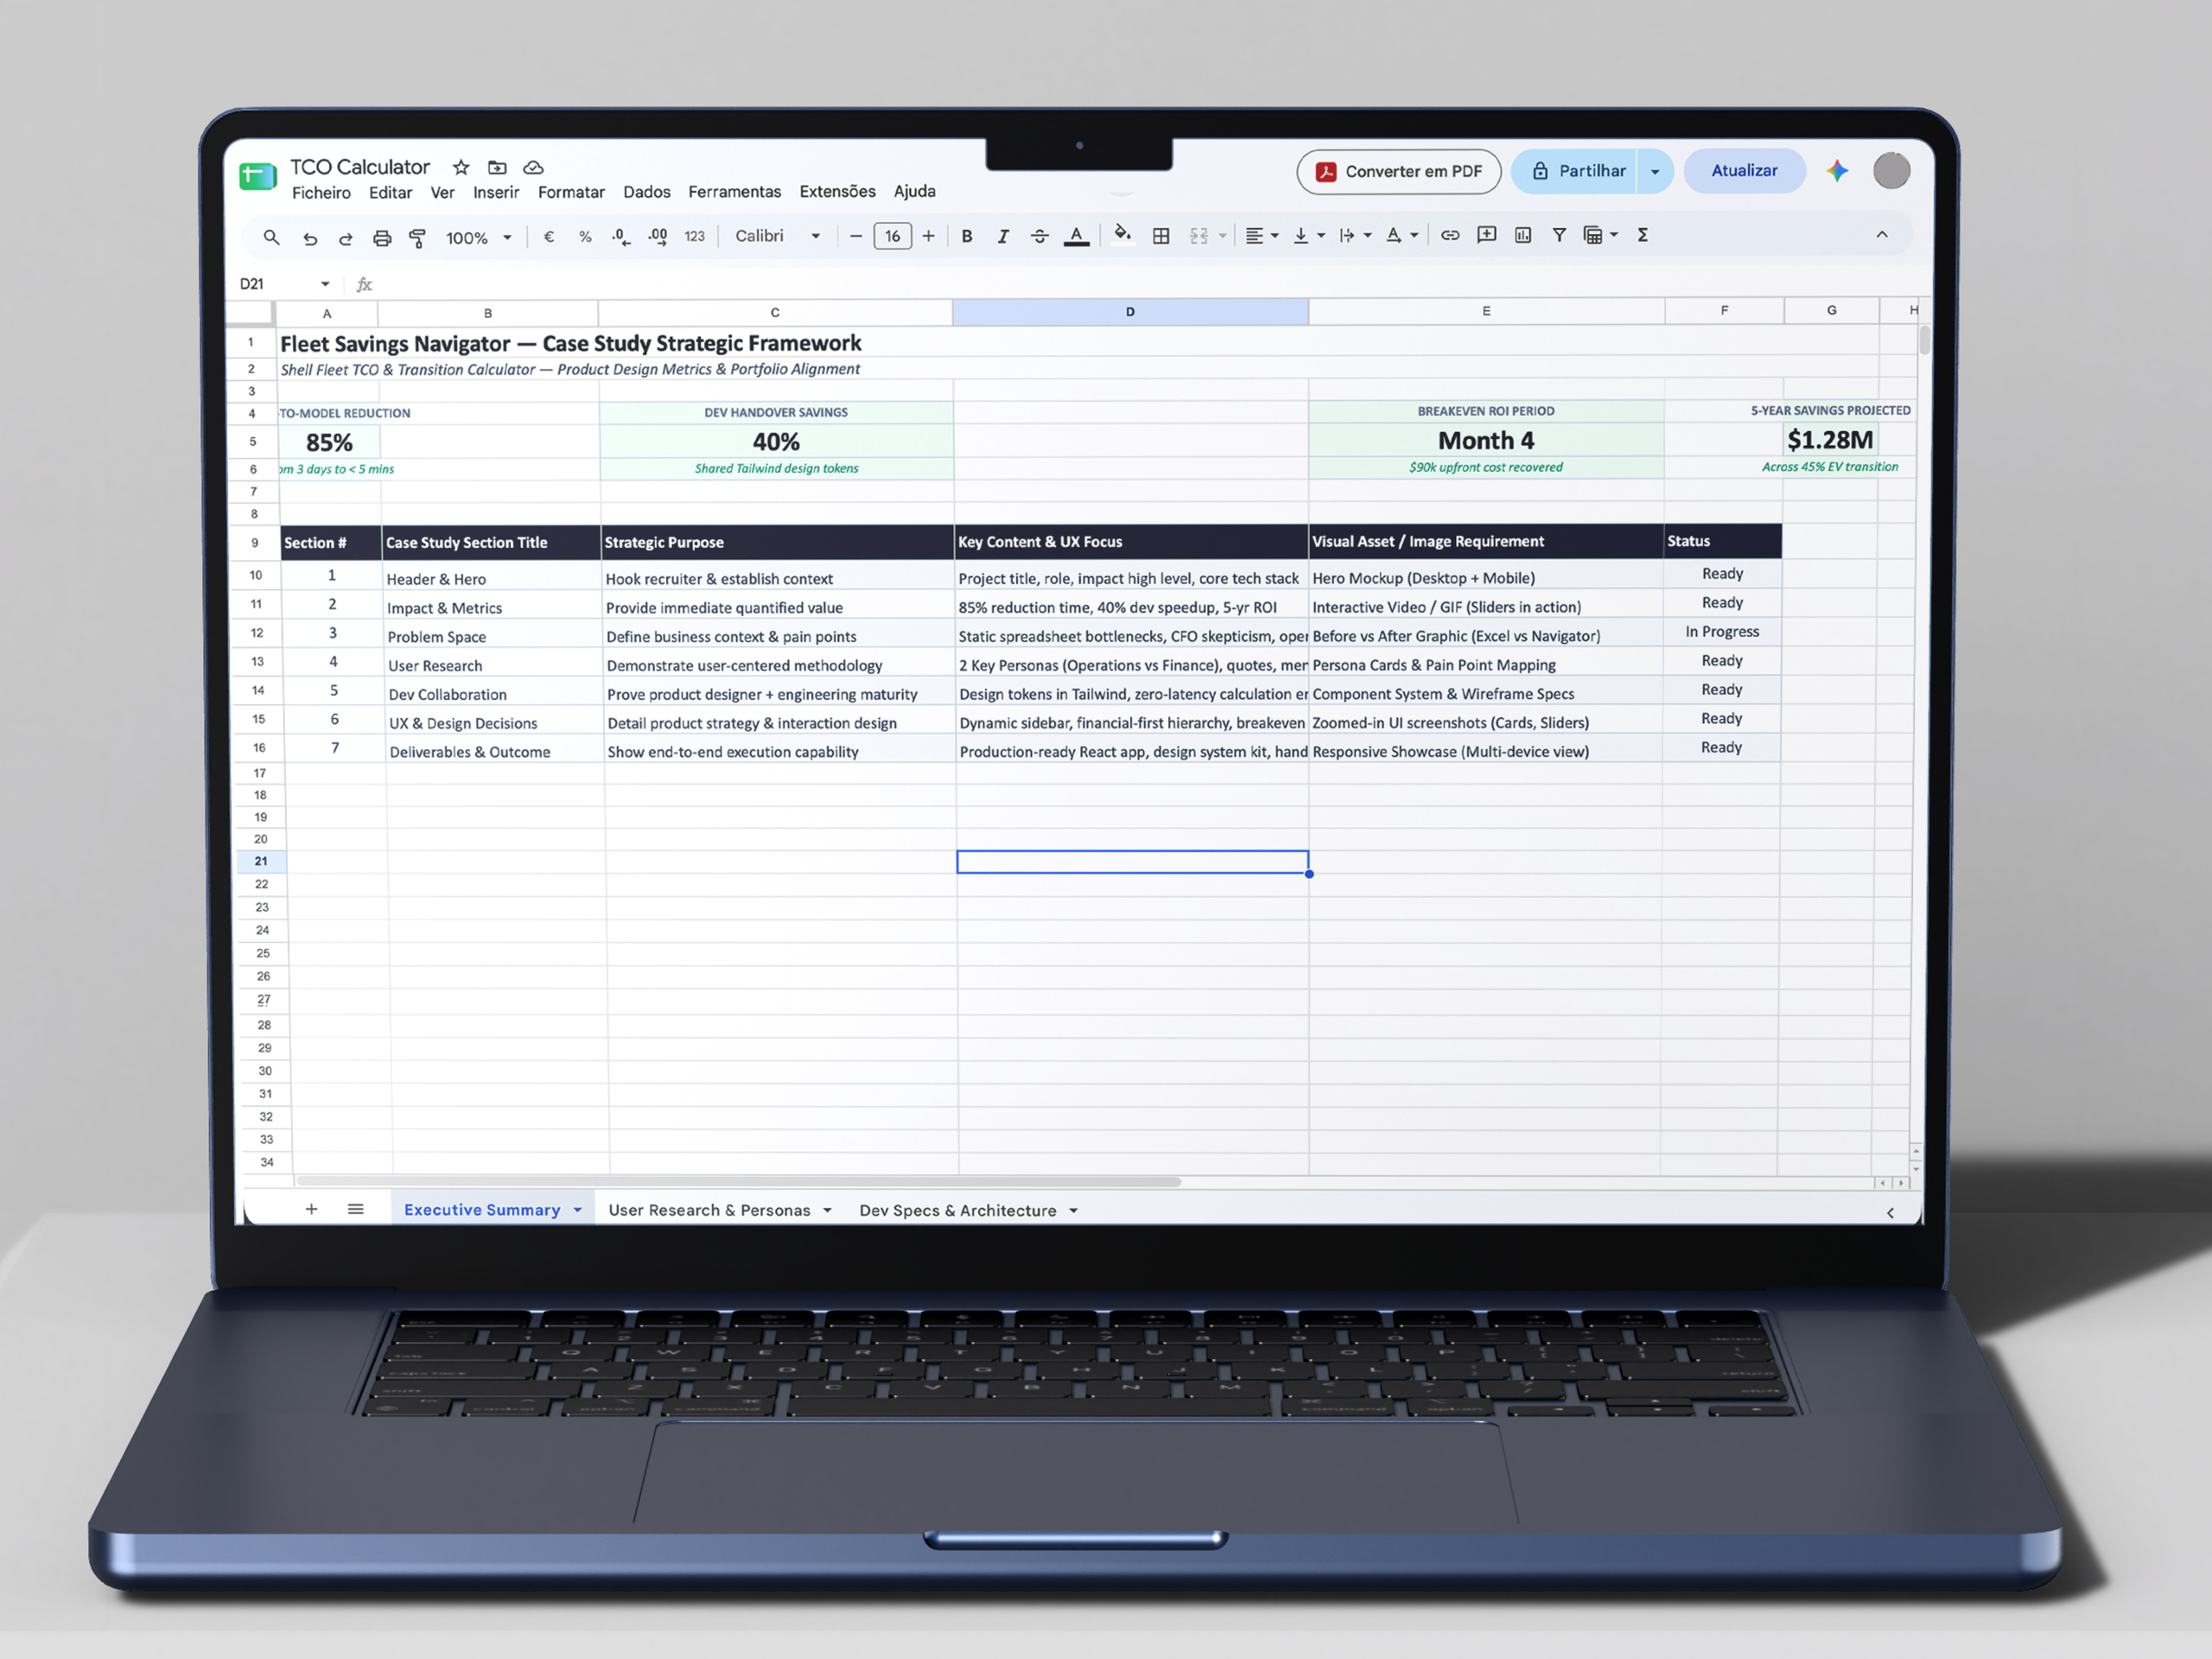
Before
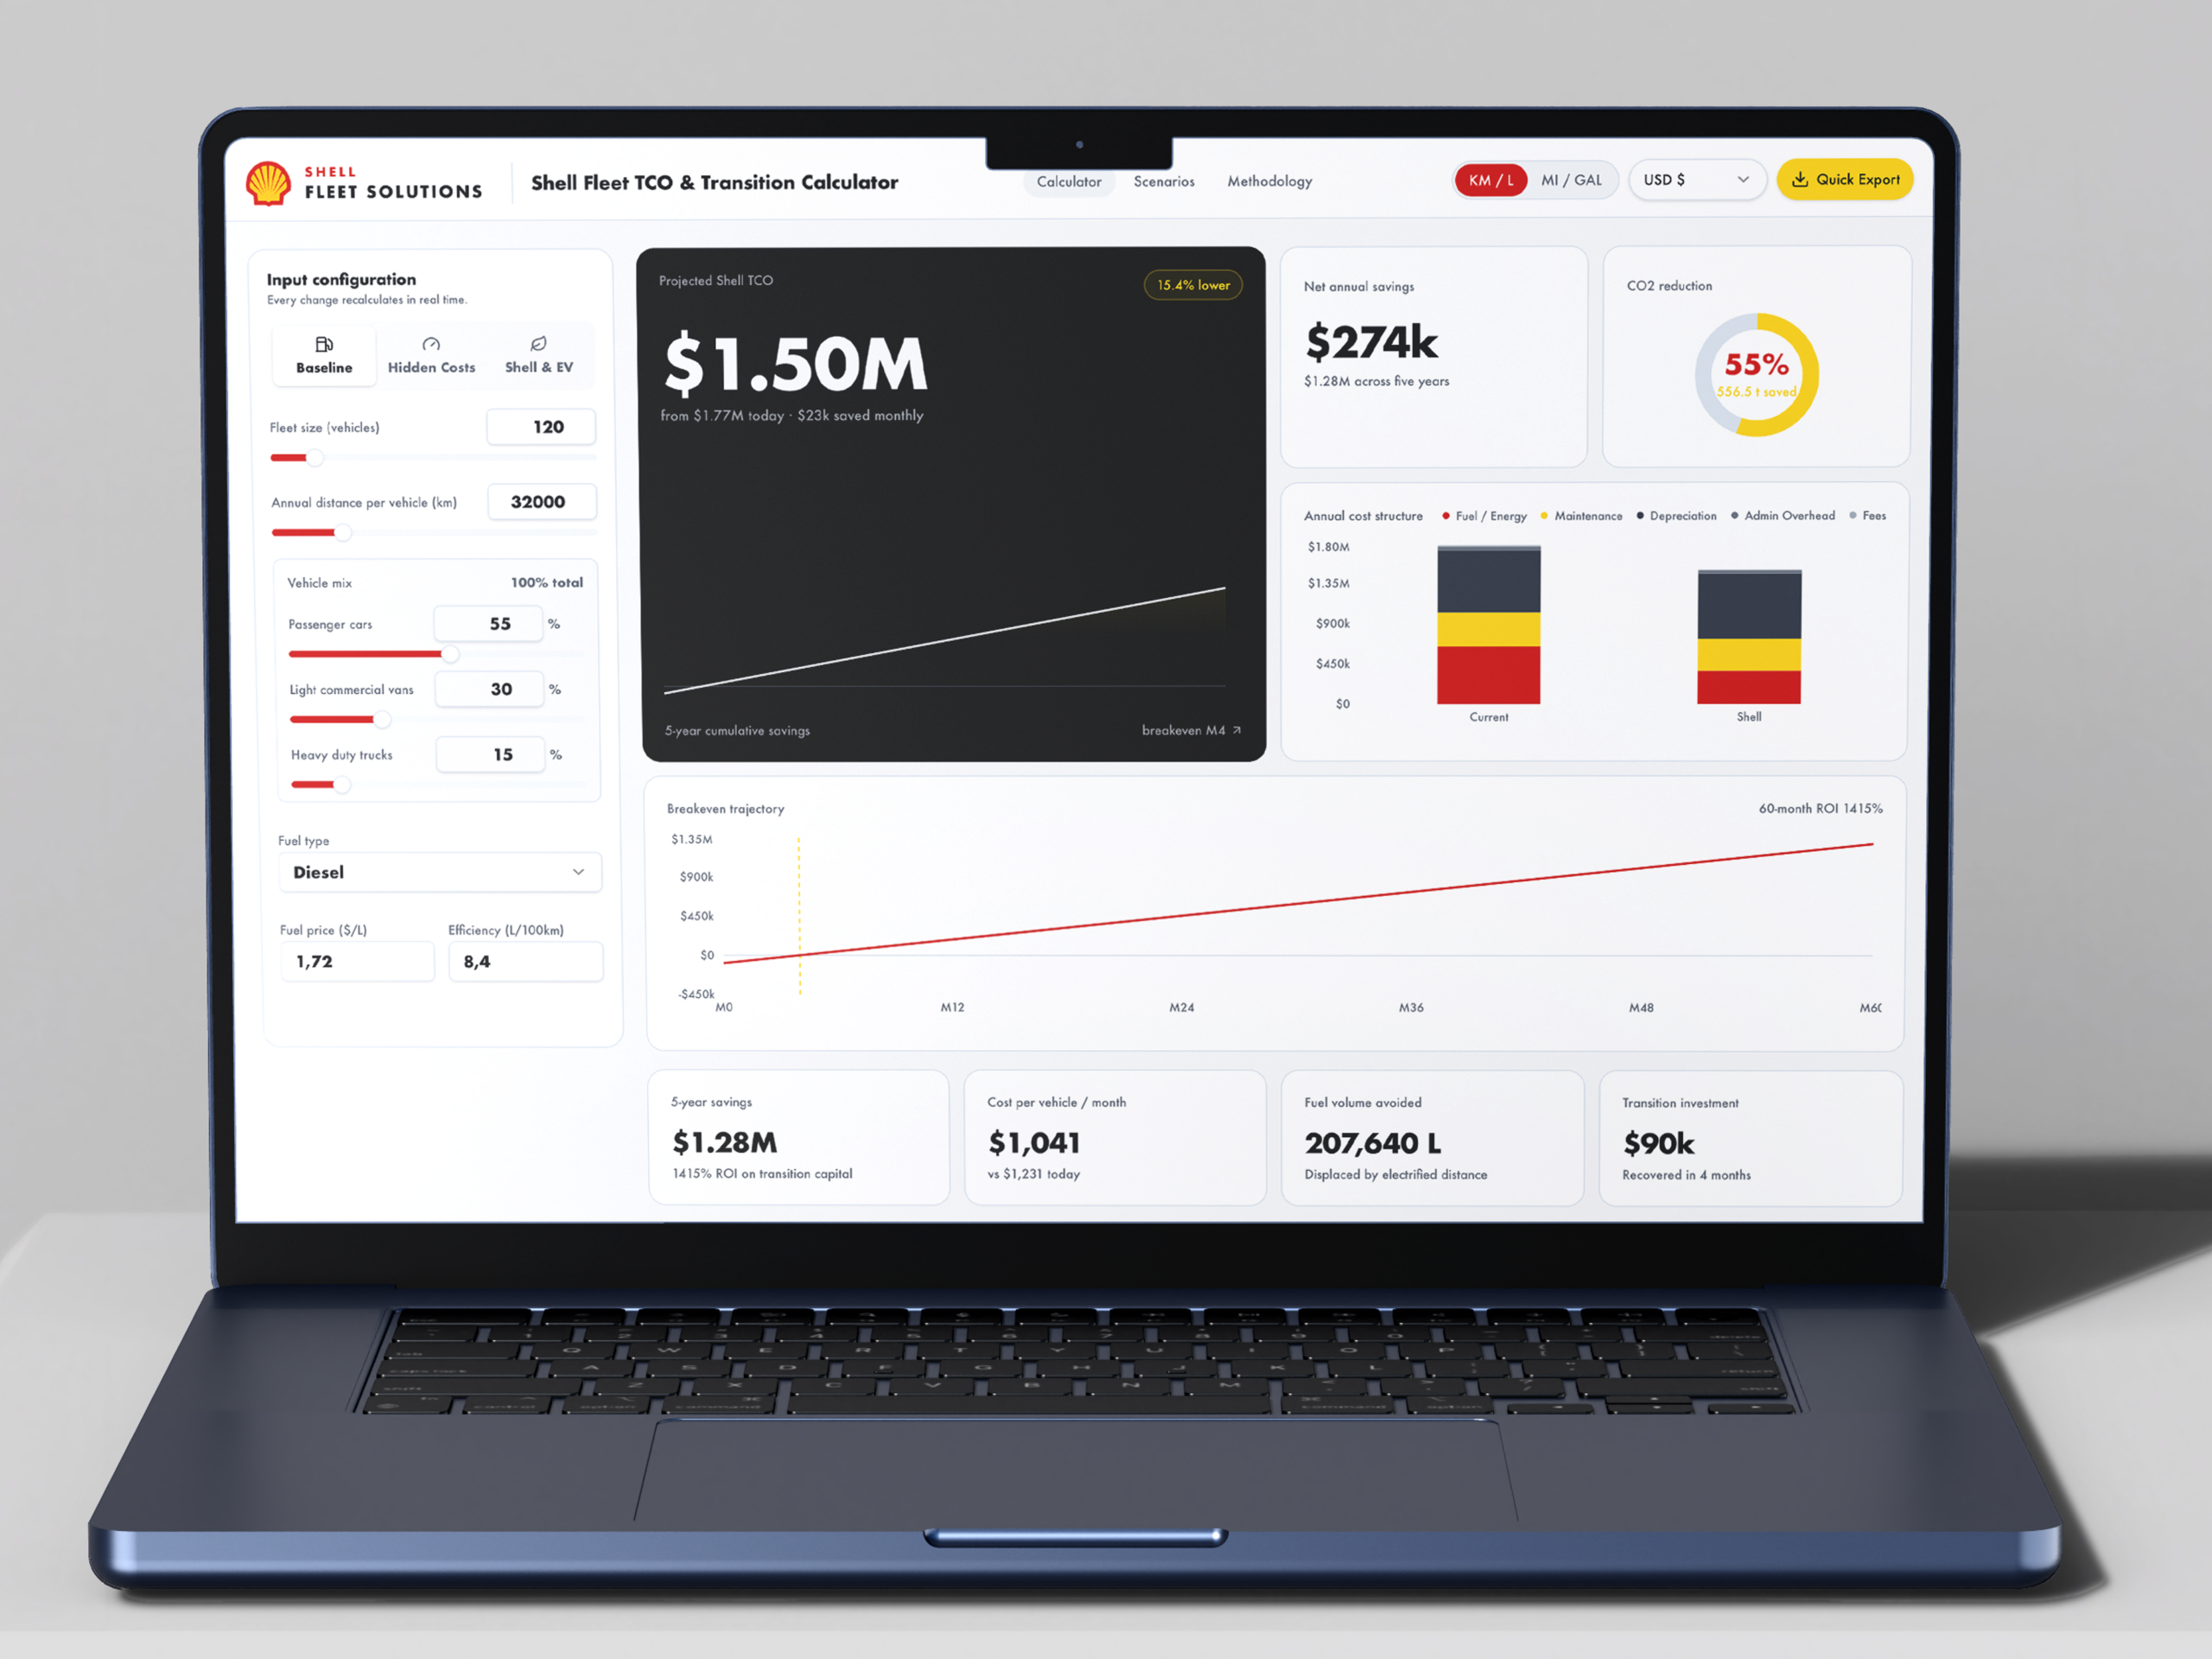
After
Research &
User Archetypes
Through interviews with Fleet Managers, Logistics Directors, and Procurement Officers, I identified two distinct personas with contrasting motivations:

Persona A: Marcus
Fleet Operations Manager (Operational Focus)
Goal: Needs to know if switching to EVs will disrupt daily delivery routes and increase downtime.
Pain Point: Frustrated by tools that don’t allow live, dynamic scenario adjustments (e.g., changing annual mileage or vehicle mix on the fly).
Quote: “If I can’t tweak the numbers live in front of my team during budget planning, the tool is useless to me.”

Persona B: Elena
Chief Financial Officer / Procurement Lead
(Financial Focus)
Goal: Needs concrete financial justification (ROI %, Net Annual Savings, Payback Month) before approving capital allocation for EV charging infrastructure.
Pain Point: Environmental metrics (CO₂ tons reduced) are nice, but cash flow breakeven is the ultimate decider.
Quote: “Show me the exact month we break even on the $90k upfront charger investment, and you have my signature.”
Process & Developer Alignment
Dev Team Always Involved
To avoid designing components that were technically infeasible or too complex to calculate in real-time on the client side, I established a “Continuous Dev Sync” workflow from Day 1:
Shared Design Tokens: Designed directly with standard utility-first principles (Tailwind design system), ensuring component parity between Figma and React code.
Real-Time Calculation Constraints: Partnered with software engineers early on to determine how quickly the backend engine could recalculate 60-month financial projections in response to slider input. We opted for client-side state recalculation to achieve zero-latency UI updates.
Agile Iteration: Validated wireframes through code prototypes (using Lovable/React components) rather than static screens, allowing developers to test mathematical model integration in parallel with UX design.
Key UX &
Design Decisions
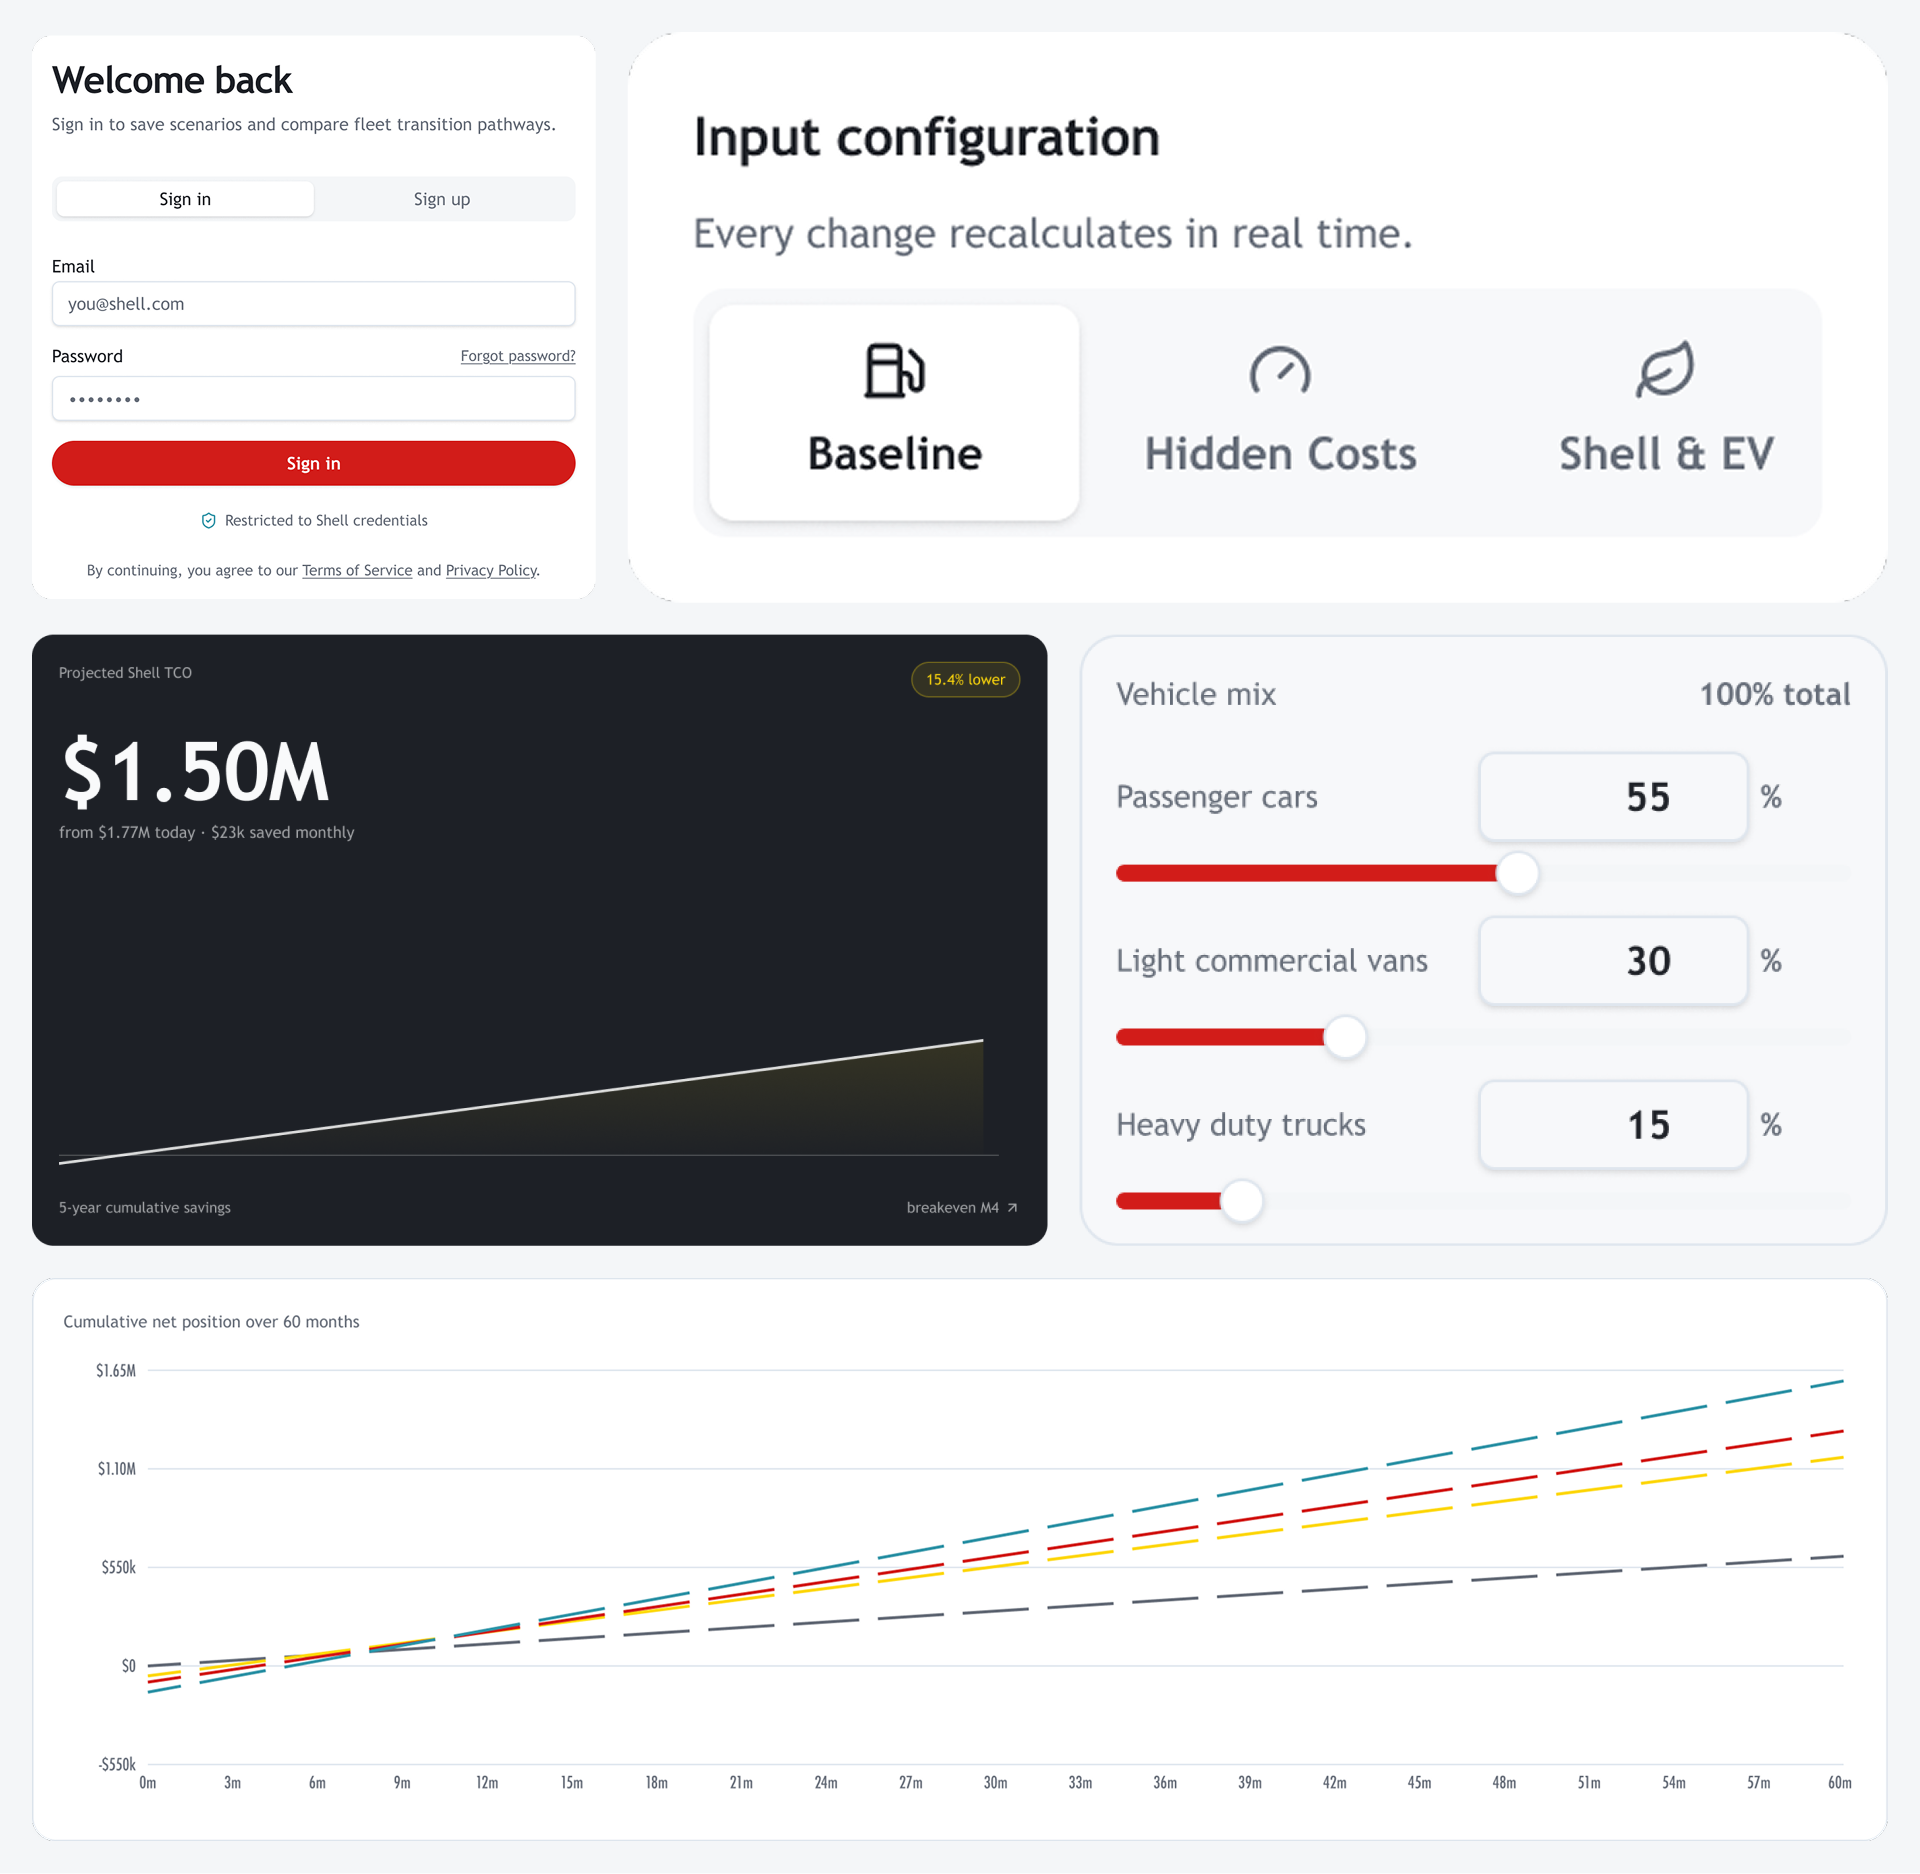
Real-Time Dynamic Input Sidebar
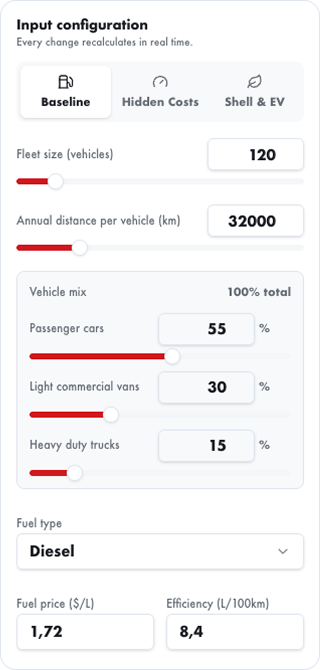
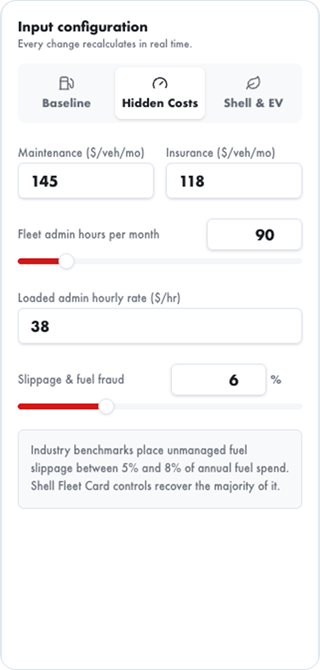
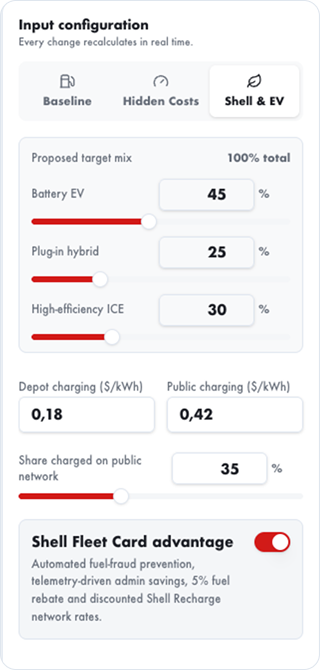
Instead of multi-step wizard forms that hide results, I implemented a persistent Input Configuration Panel. Users can manipulate the fleet size, annual mileage slider, and vehicle mix (% ICE vs % EV) with instant visual feedback across the dashboard.
Simplifying Complex Financial Scenarios
Instead of overwhelming users with multi-tab data tables, I designed an integrated Breakeven & Cost Breakdown Chart that combines fuel/energy, maintenance, depreciation, and admin overhead into unified stacked visualizations.
What Was Delivered
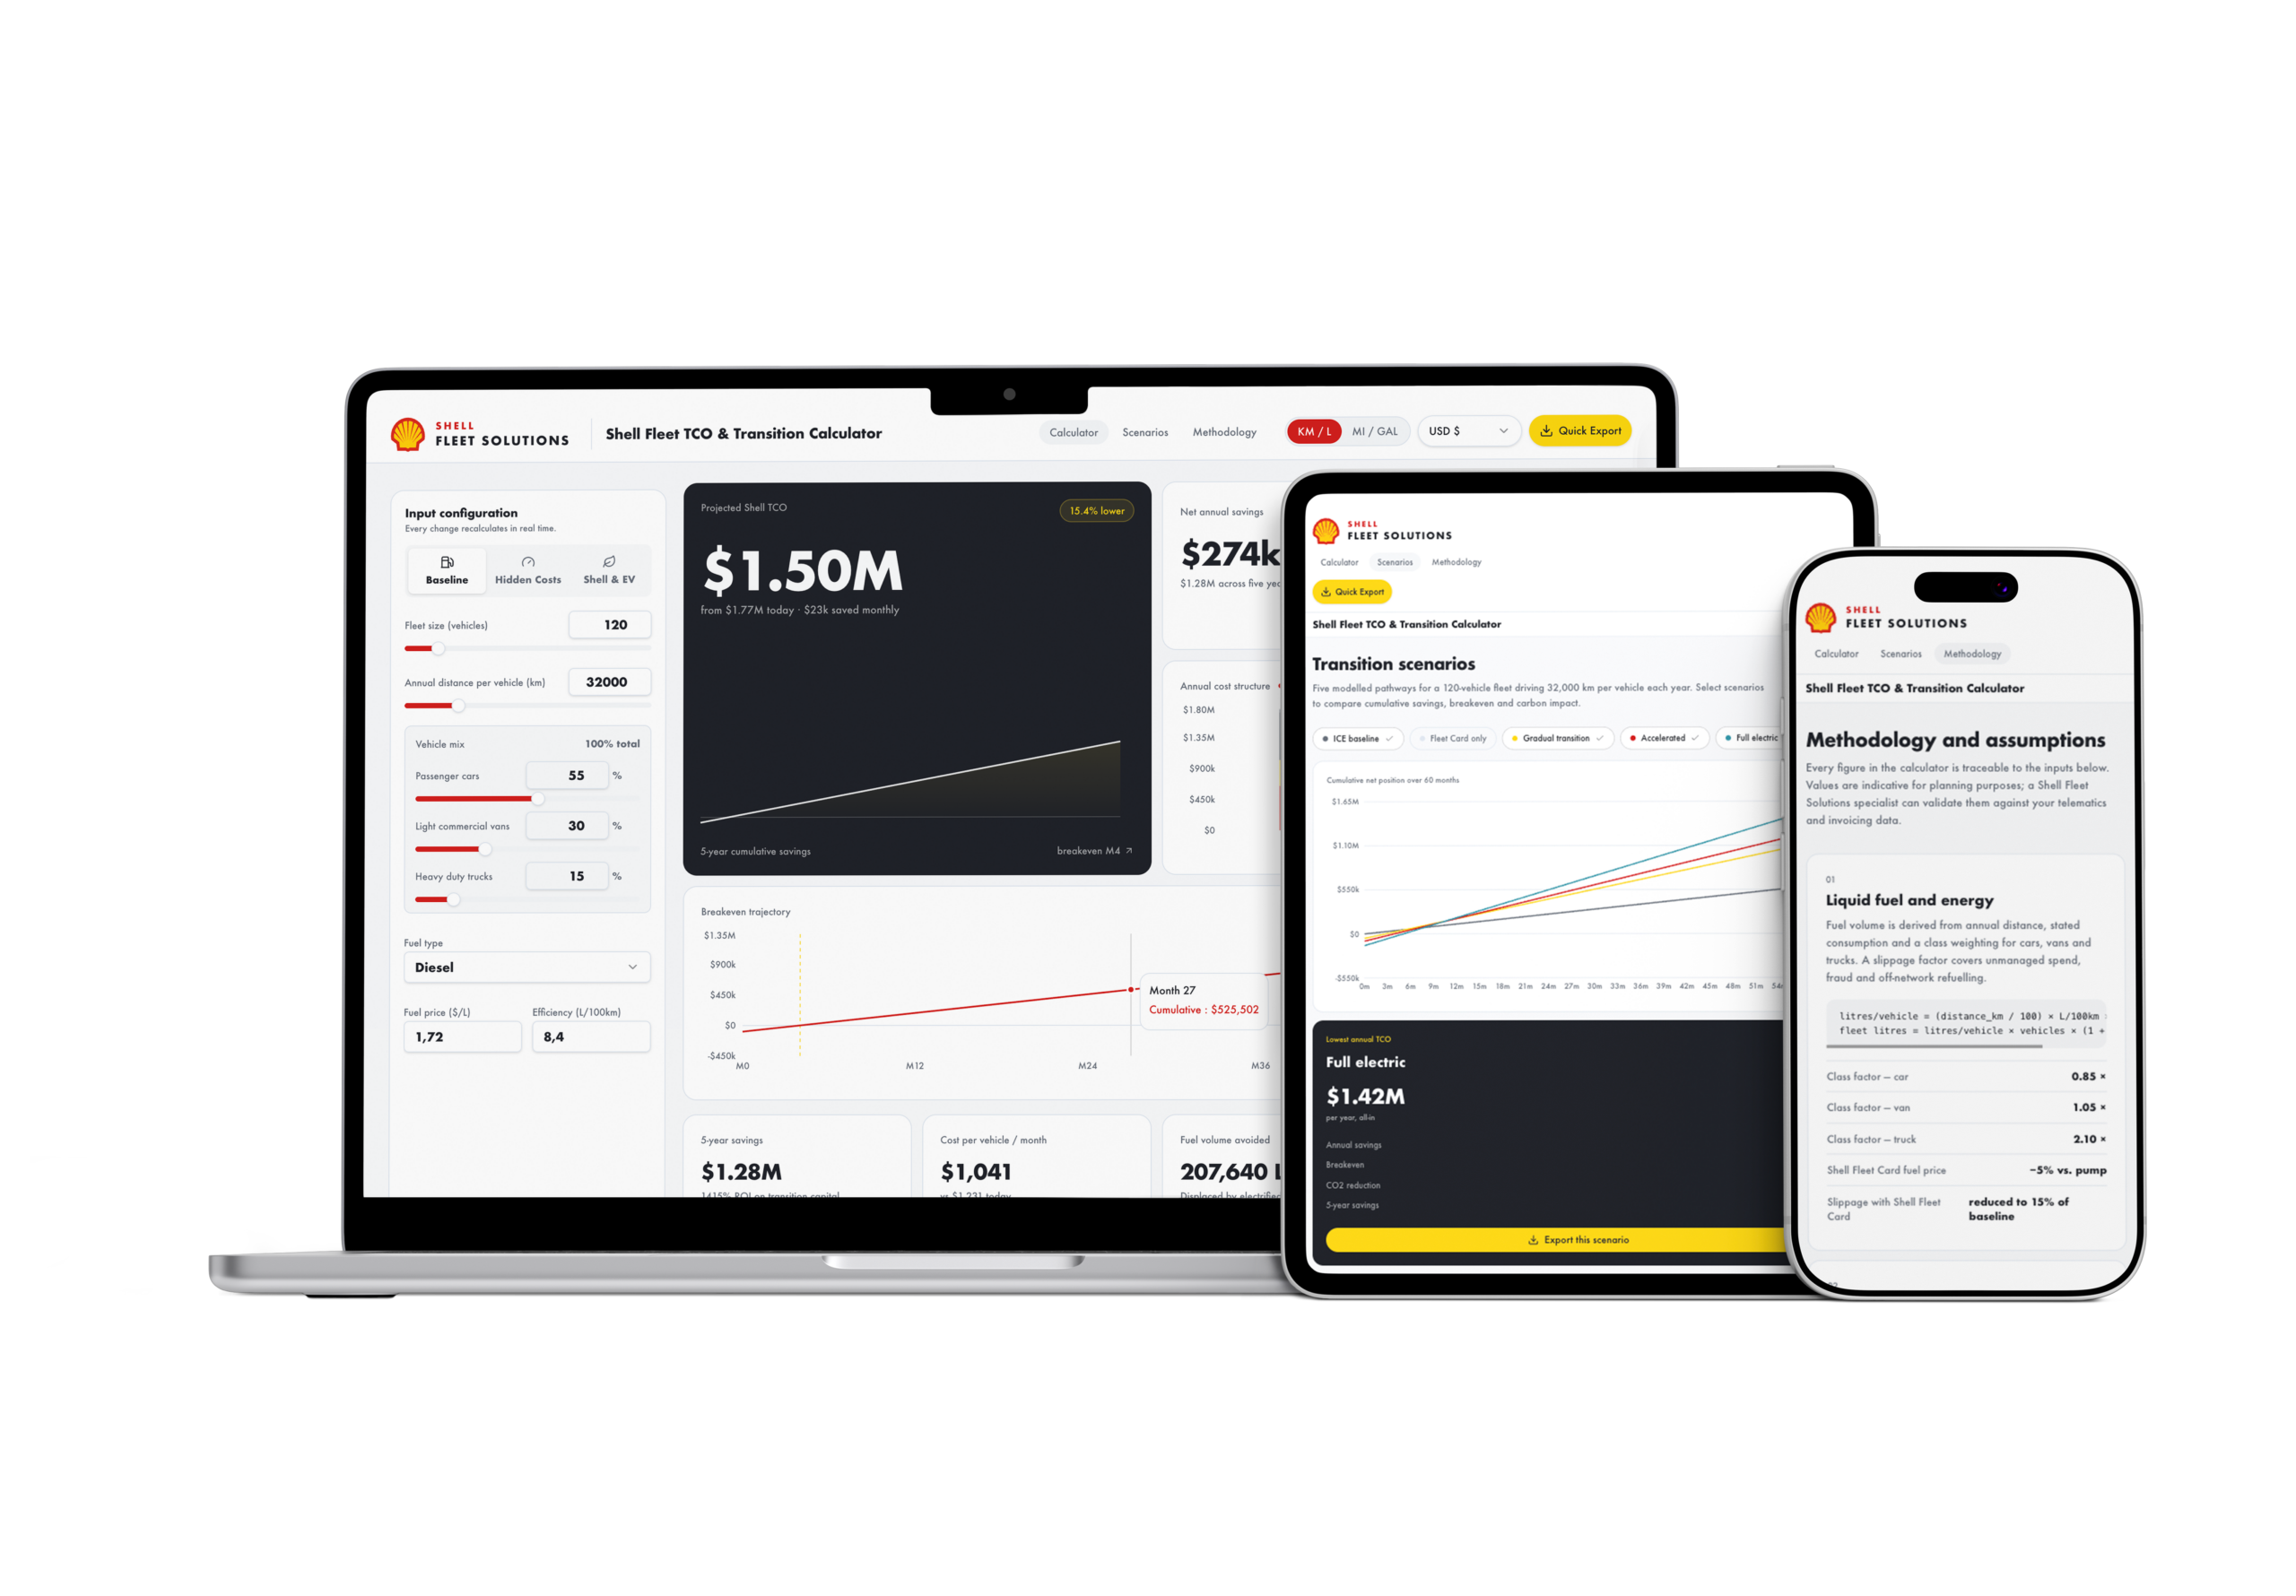
Interactive Fleet TCO & Transition Calculator: A fully responsive web app capable of real-time multi-variable financial modeling.
Component-Based UI Kit / Design System: Scalable cards, metric callouts, custom sliders, and data charts tailored for dark/light dashboard layouts.
Handoff & Implementation Package: Clean component structure integrated into React/Tailwind, enabling developer deployment in record time.