Shell Trade & Supply — Qatar Power Plant Operations
PowerLink Logistics
Unified end-to-end supply chain ecosystem & real-time spare part logistics platform for energy plants
Scope
Product Strategy, UX Research, Supply Chain Architecture, Multi-tier Vendor Mapping, Real-time Shipment Tracking, System Consolidation
My role
Lead Product Designer (Sole Designer) & Frontend Developer
Tools


Taming Data Chaos in Heavy Energy Operations
The Challenge
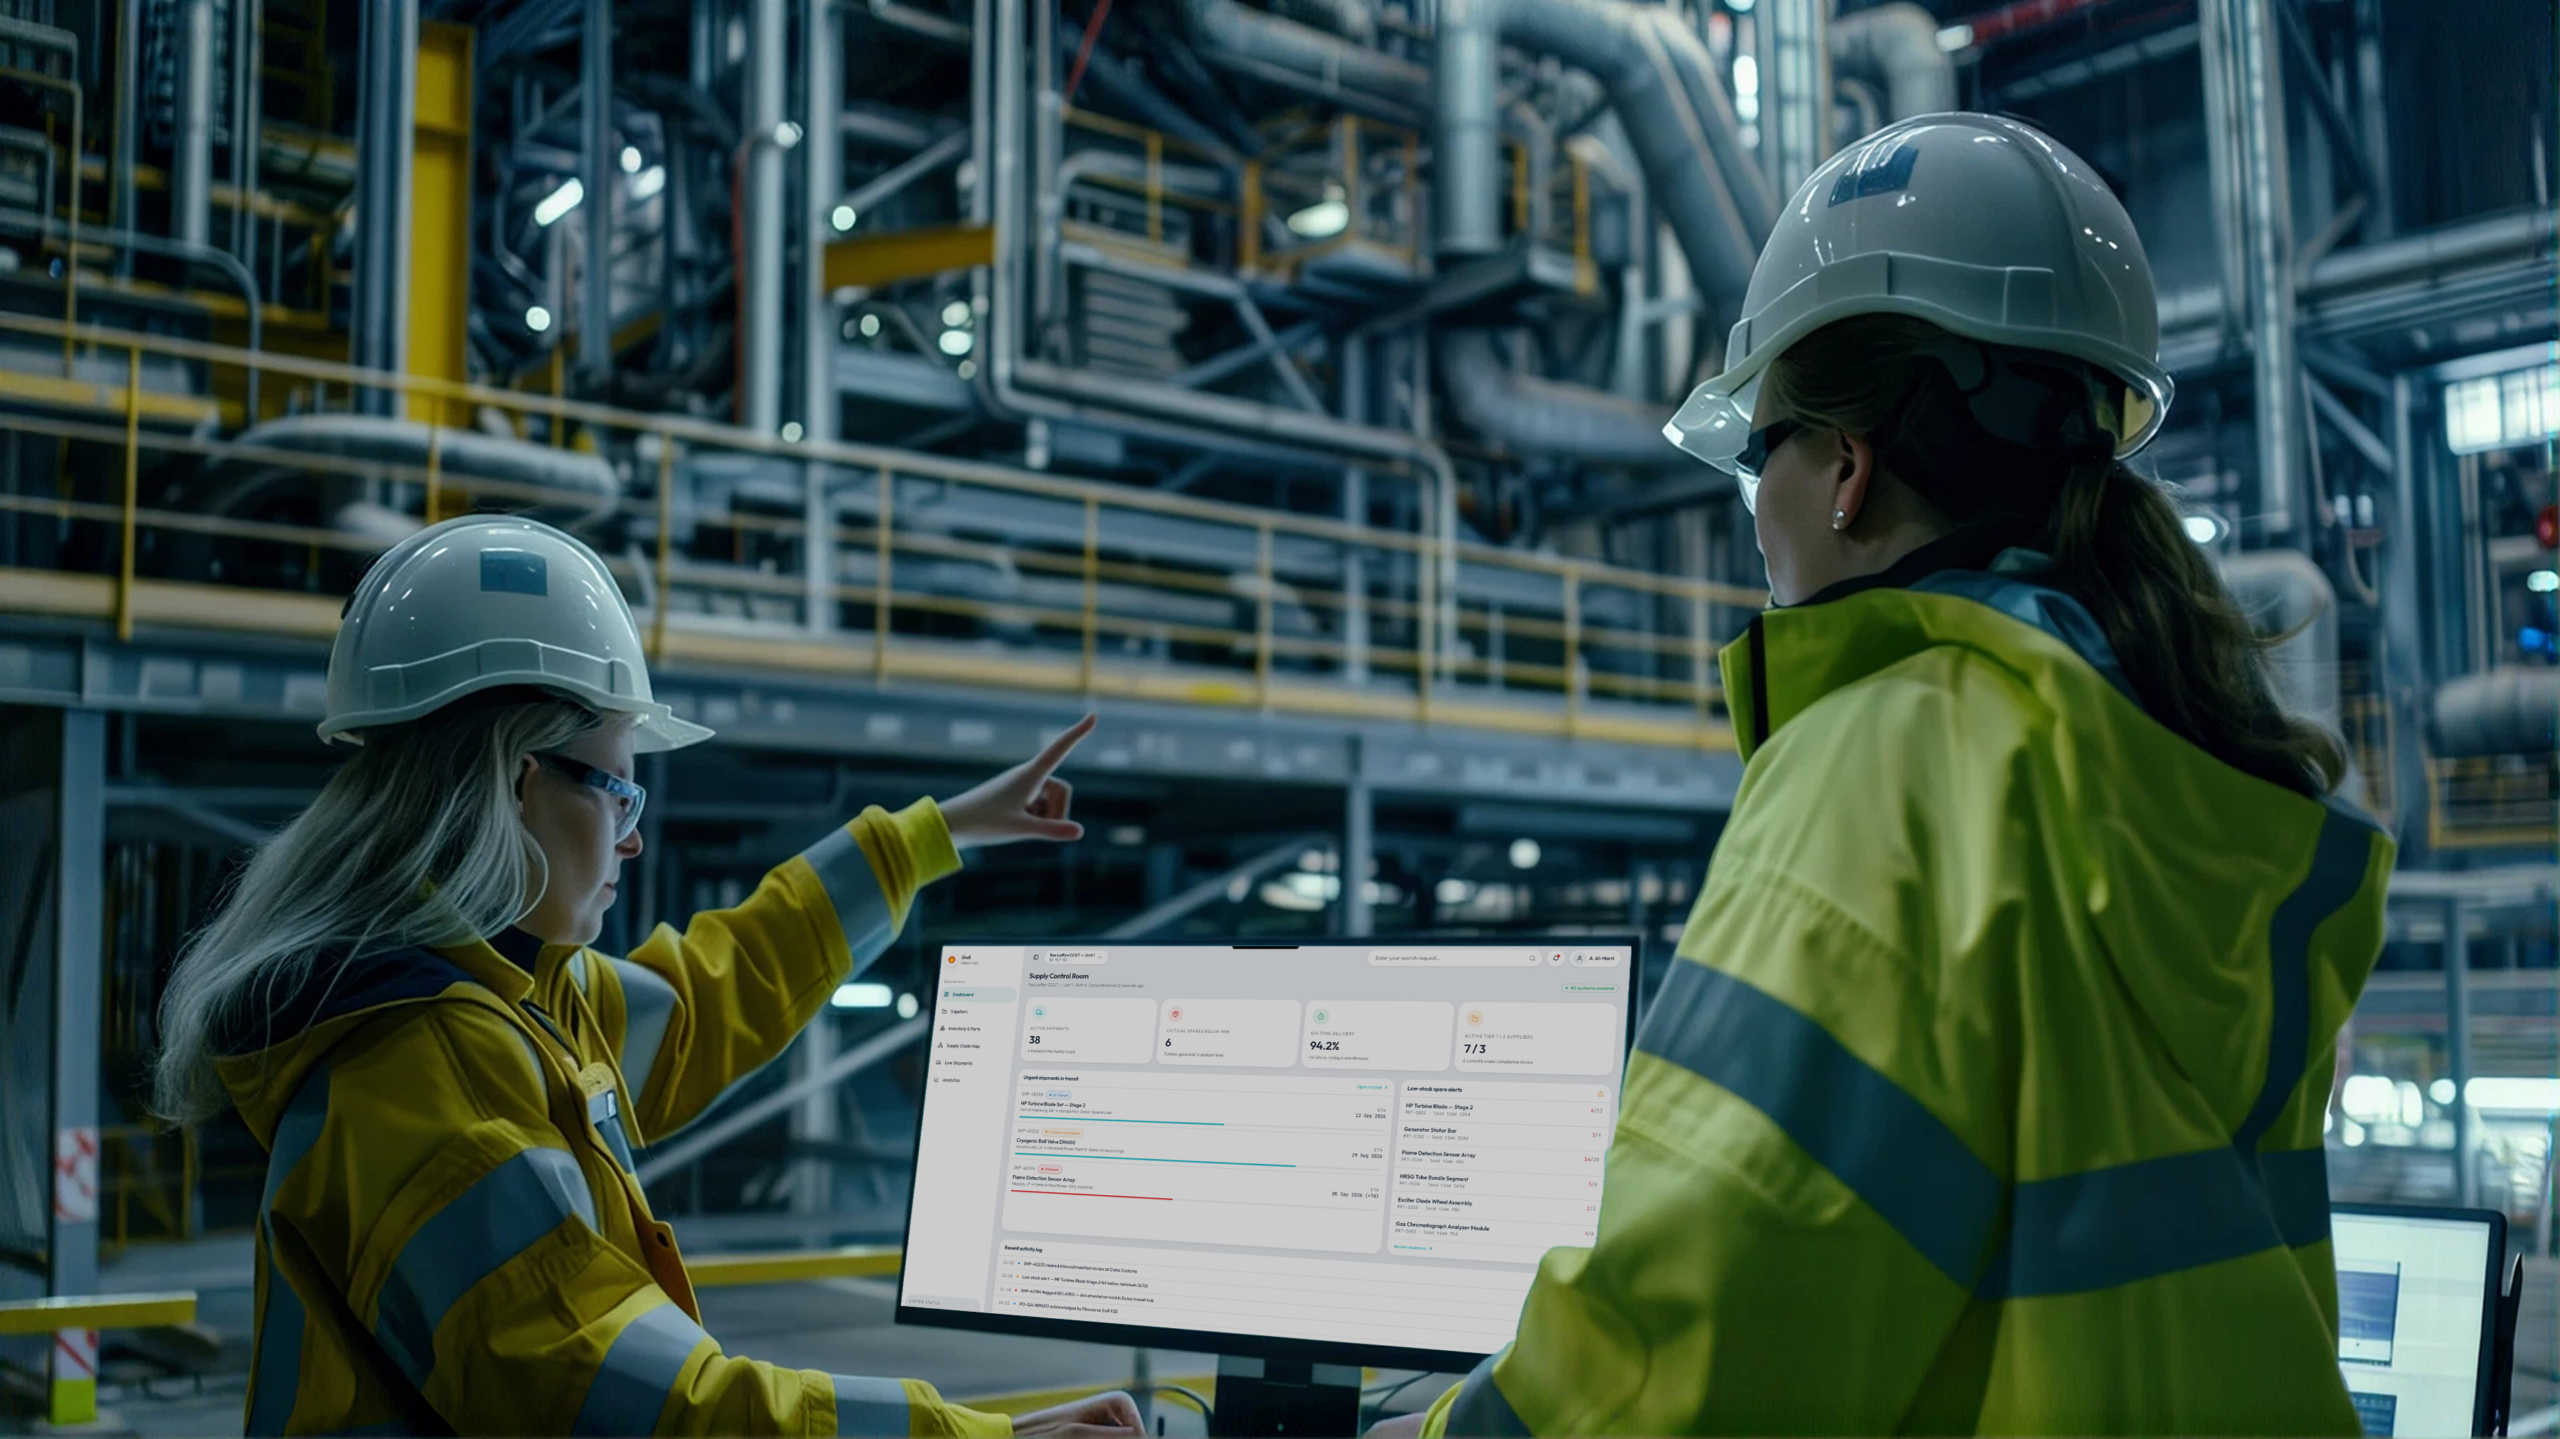
Operating a world-scale energy plant in Qatar involves managing tens of thousands of specialized machinery components, heavy turbines, and a complex multi-tiered global supply chain. Historically, Shell’s Trade & Supply division and on-site plant engineers operated in deep information silos.
Workers were forced to manually stitch together information across disconnected tools:
Power BI Dashboards: High-level corporate reporting, but static and non-actionable for daily operations.
Legacy ERP Systems: Dense database tables with low usability for on-site technicians.
Manual Spreadsheets & Email: Used by logistics teams to track Tier-2/3 vendors and shipping milestones.
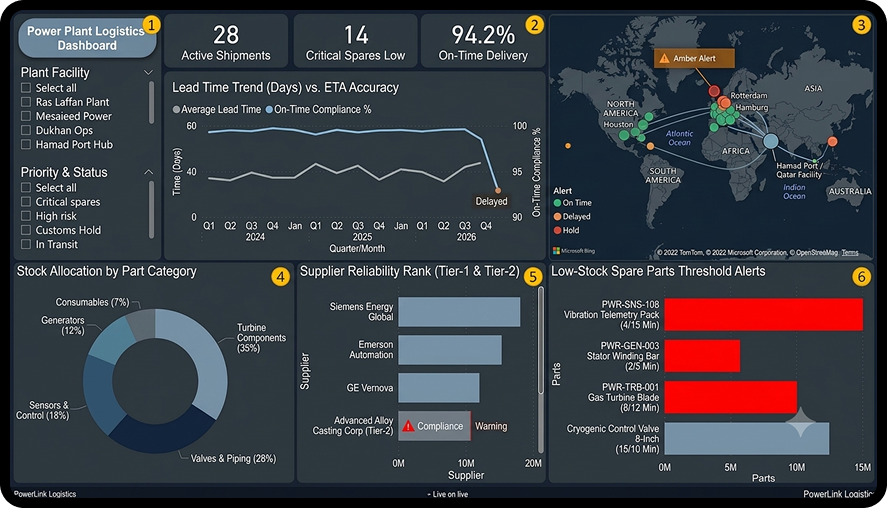
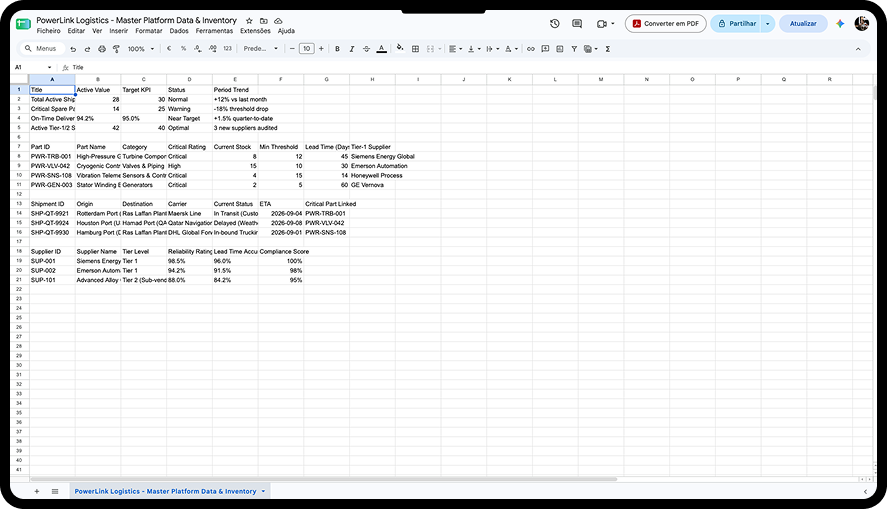
The Fragmented Ecosystem (Before)
Research & User Archetypes
Contextual inquiries with plant personnel in Qatar revealed two contrasting user personas with distinct mental models:

Persona A: Tariq
On-Site Maintenance Lead (Qatar Plant)
Goal: Needs to know if switching to EVs will disrupt daily delivery routes and increase downtime.
Pain Point: Frustrated by tools that don’t allow live, dynamic scenario adjustments (e.g., changing annual mileage or vehicle mix on the fly).
Quote: “If I can’t tweak the numbers live in front of my team during budget planning, the tool is useless to me.”

Persona B: Sarah
Supply Chain Specialist (Shell Trade & Supply)
Strategic Focus: Manages global logistics, customs clearance, and vendor compliance.
Pain Point: Spends hours manually compiling data from shipping providers and emails to update plant management.
Quote: “When a cargo vessel is delayed, I need to see the domino effect on sub-suppliers and plant operations immediately.”
Core Workflows
in Action
Instead of designing static dashboard views, the UX architecture was built around 2 Critical Operational Workflows:
Workflow 1:
The 2-Minute Part Search & Asset Tracking
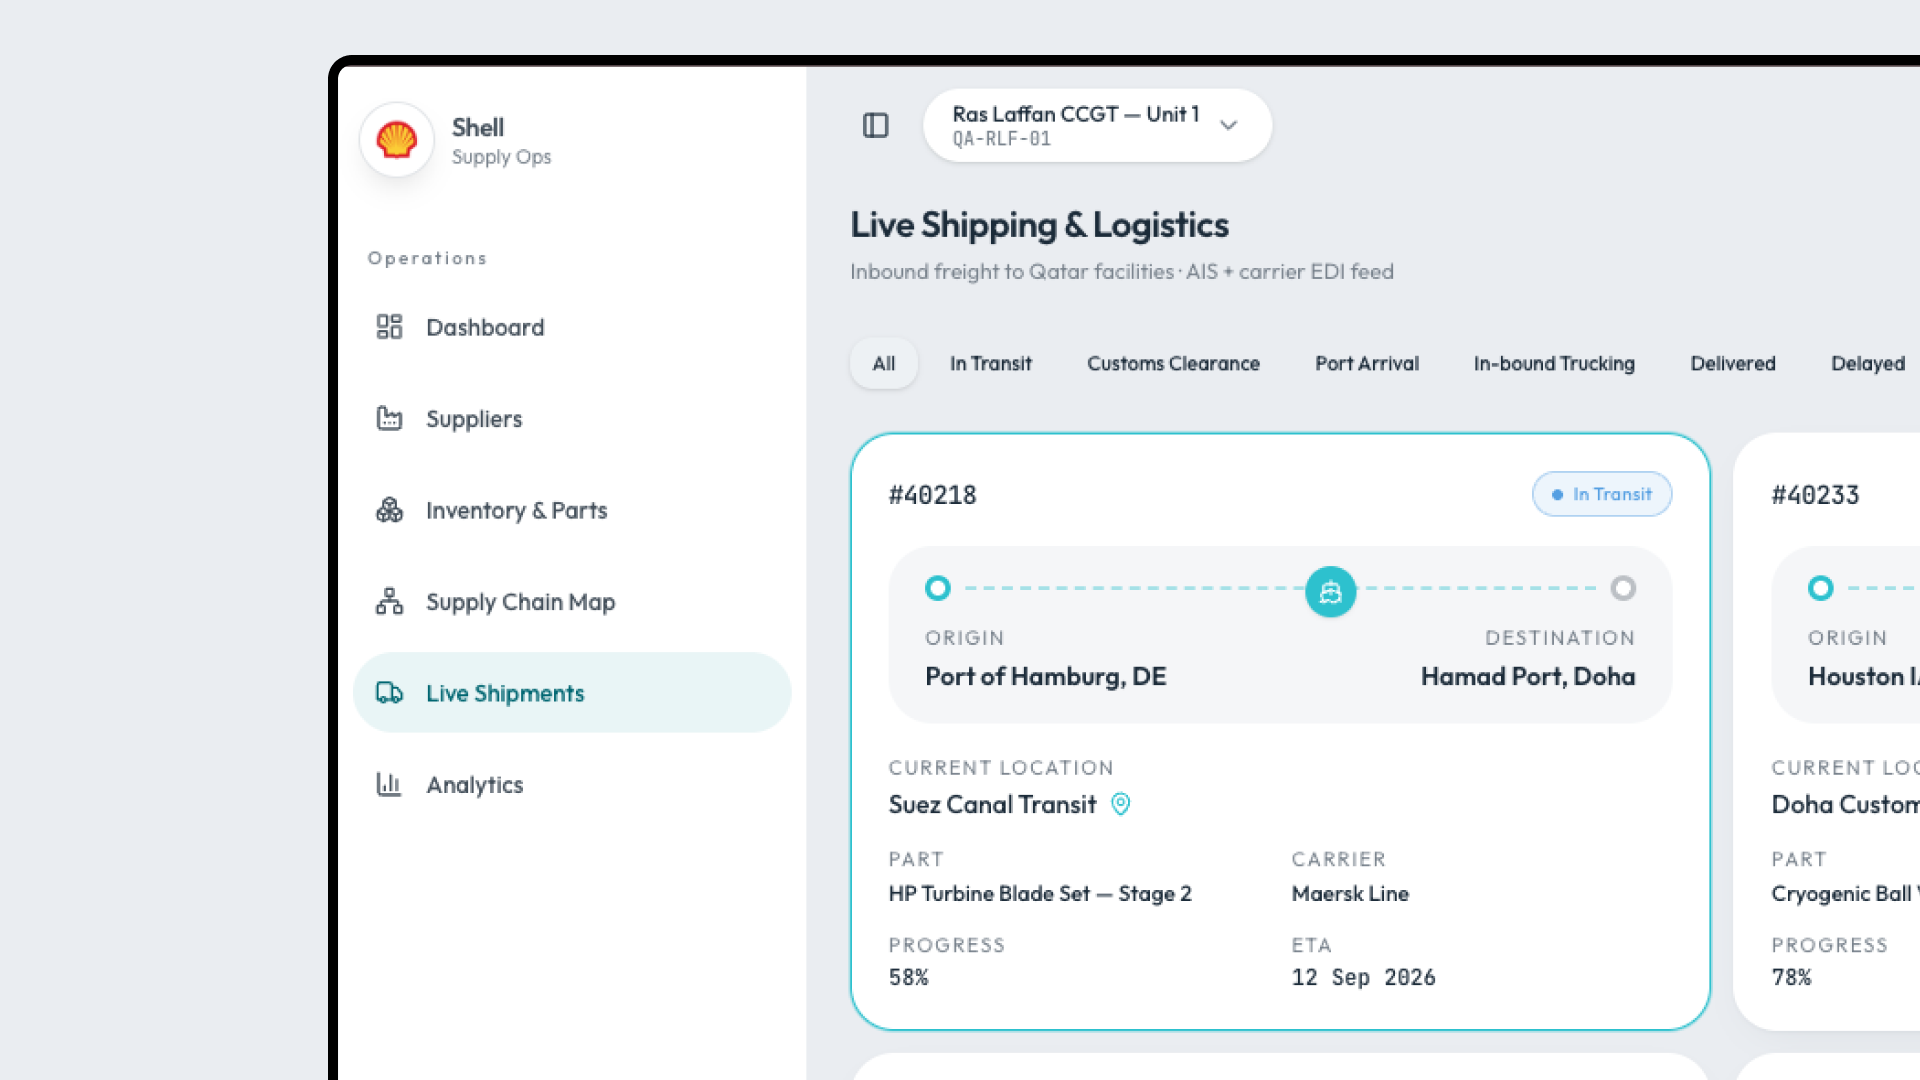
Engineers on-site can search by part number, machinery model, or supplier. The system returns a clean visual breakdown of current warehouse stock levels, compatible units, and live inbound shipments.
Workflow 2:
Exception-Based Delay Mitigation (What-If Simulation)
Detection: Visual alert triggers on the global map.
Impact Assessment: Shows which power plant unit relies on that shipment.
Action: Logistics managers can simulate contingency options (What-If Analysis) to reroute parts or adjust maintenance windows directly from the interface.
Key UX & System Architecture Decisions
Dynamic Tier-Map Vendor Graph
Designed a visual relational tree that maps primary vendors (Tier 1) down to raw material sub-suppliers (Tiers 2 & 3). Logistics teams can pinpoint single-point-of-failure risks long before they disrupt supply lines.
Live Telemetry Shipping Map
Integrated real-time vessel and air freight tracking into a dark-mode-optimised logistics map, built specifically for continuous monitoring in control room environments.
What Was Delivered
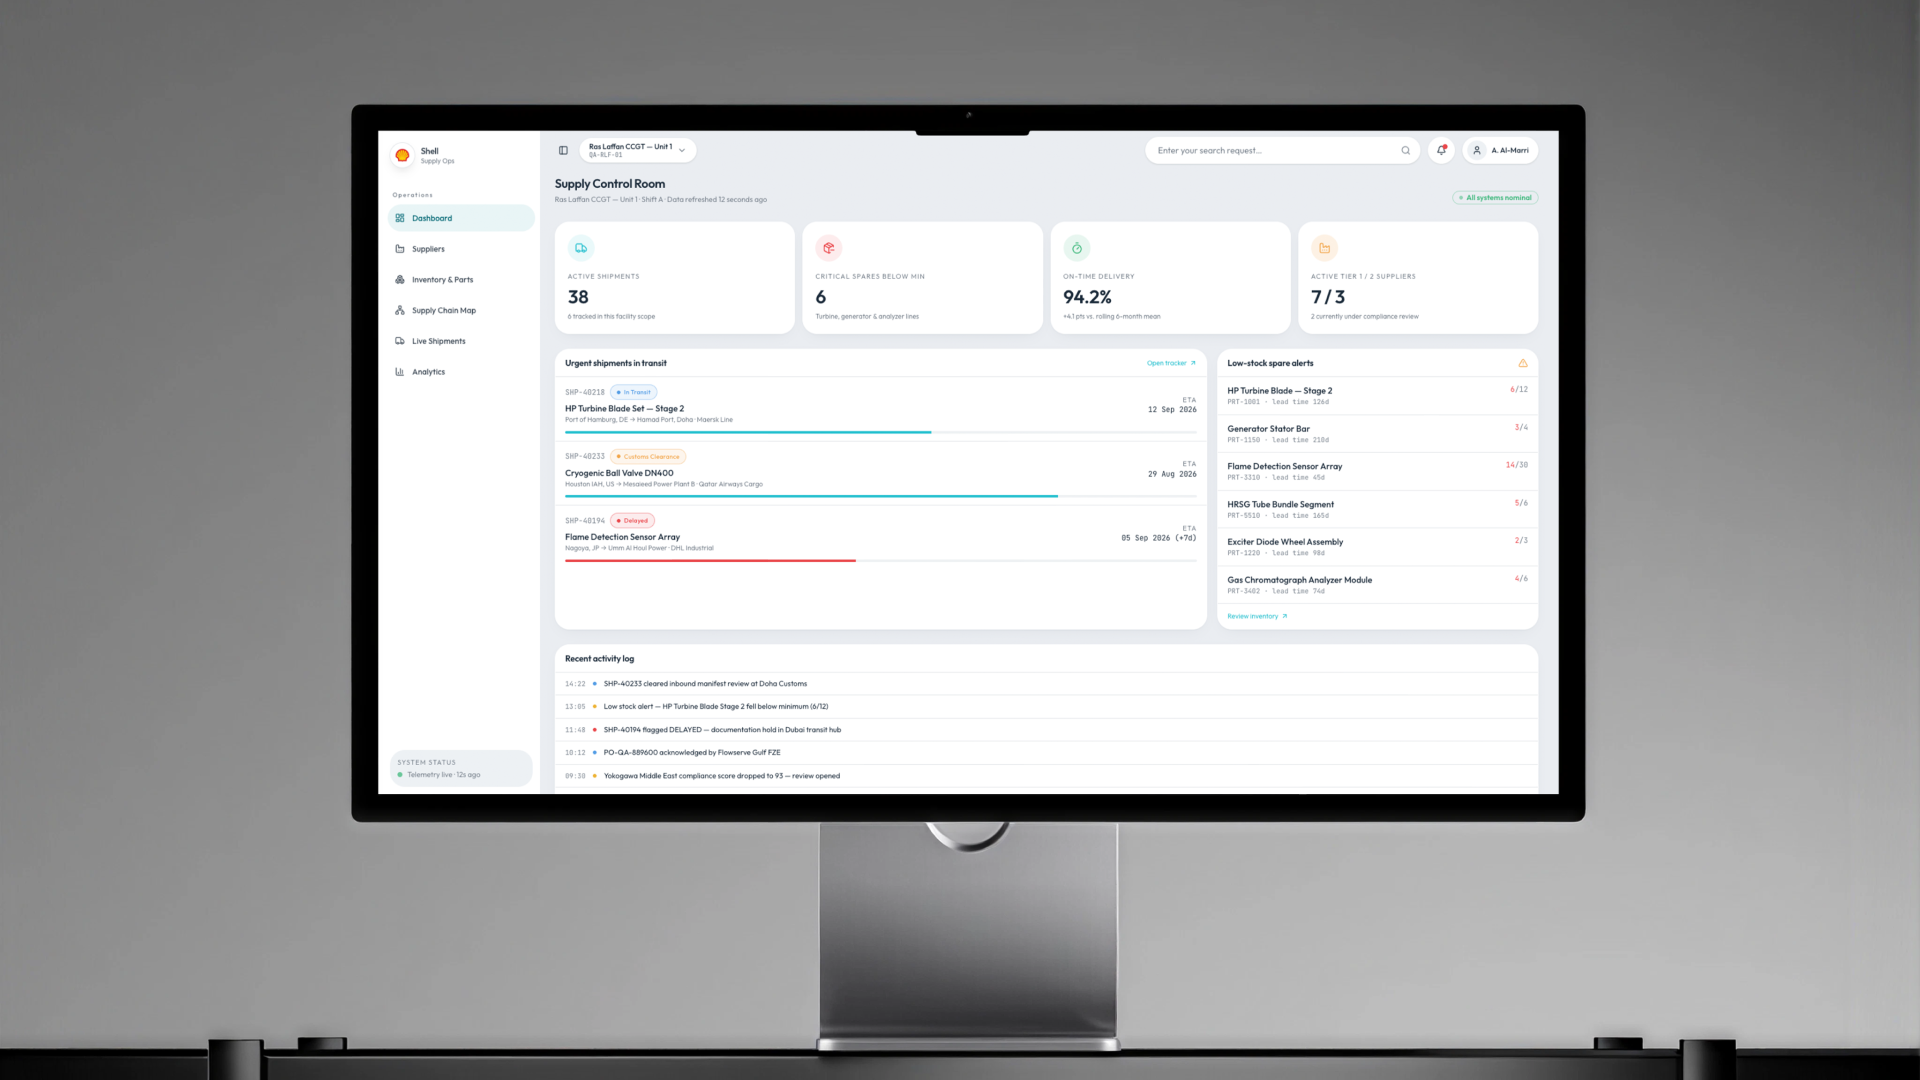
Production-Ready Prototype: Fully interactive dashboard prototype built with Tailwind CSS, Lucide icons, and Shadcn UI components.
6 Mission-Critical Views:
1. Main KPI Control Tower Dashboard
2. Live Shipping & Logistics Tracker
3. Multi-Tier Supply Chain Map
4. Parts & Inventory Directory (with schematics modals)
5. Supplier Performance Directory
6. Global Facility Switcher (Qatar Energy Hubs)
Design System: A modular, reusable UI kit ready for immediate frontend deployment.